lintsampler#


When you have a density function, but you would like to create a set of sample points from that density function, you can use linear interpolant sampling. Using the evaluation of the density at the two endpoints of 1D interval, or the four corners of a 2D rectangle, or generally the \(2^k\) vertices of a \(k\)-dimensional hyperbox (or a series of such hyperboxes, e.g., the cells of a \(k\)-dimensional grid), linear interpolant sampling is a technique to draw random samples within the hyperbox. lintsampler provides a Python implementation of linear interpolation sampling, using only numpy. The source code is a public repository on GitHub.
These pages describe how linear interpolation sampling works and how to use lintsampler. We have also written a paper describing lintsampler.
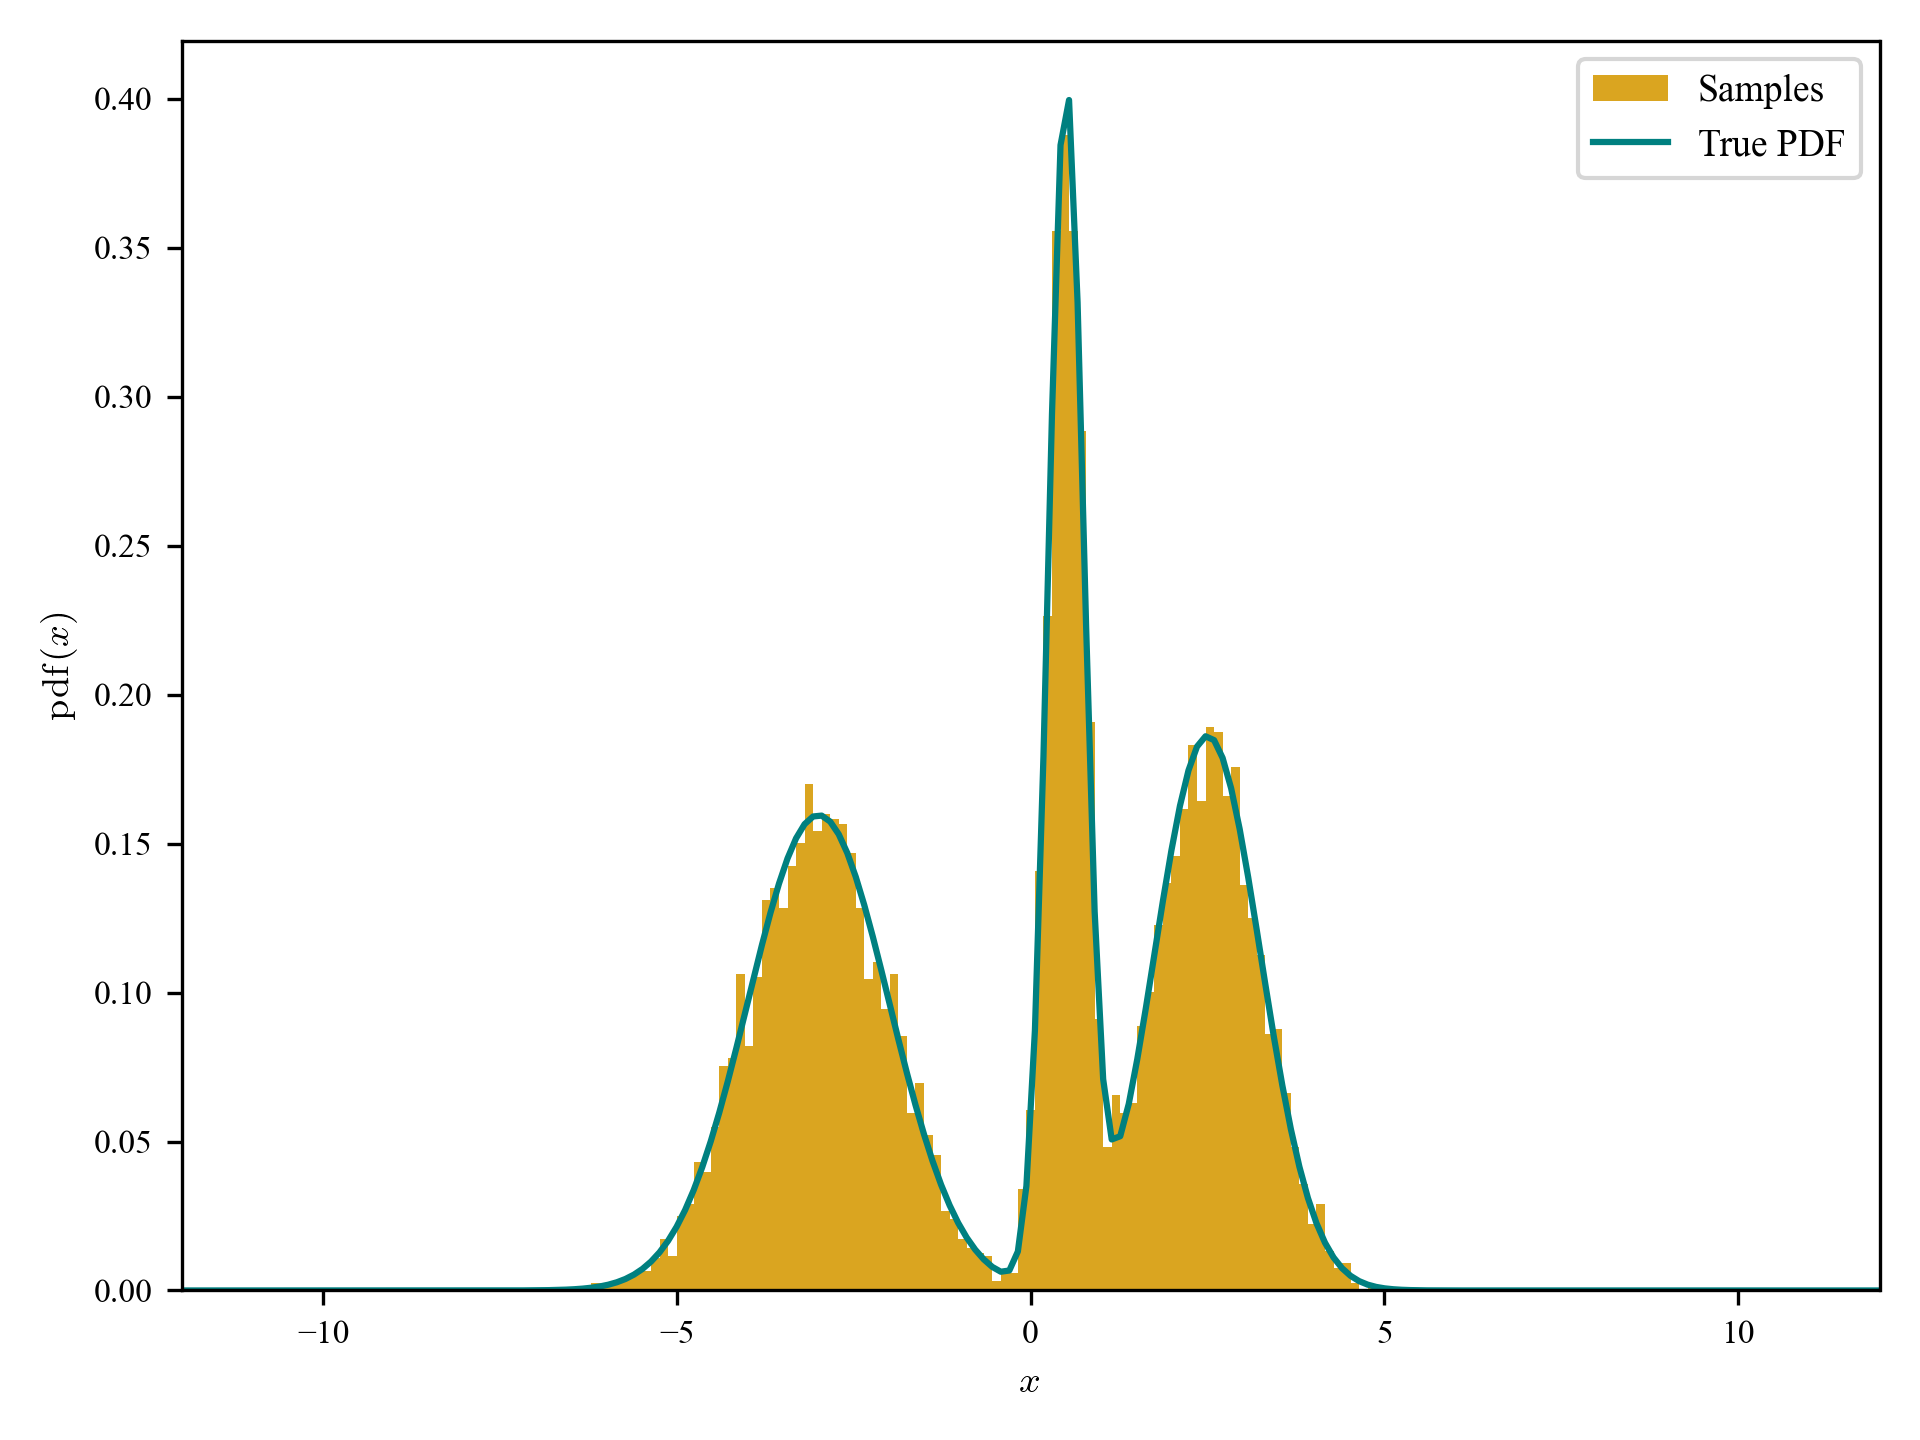
For example, if you have a density function, such as this multi-modal 1d pdf with the bulk of the density between -7 and 7,
import numpy as np
from scipy.stats import norm

def gmm_pdf(x):
    mu = np.array([-3.0, 0.5, 2.5])
    sig = np.array([1.0, 0.25, 0.75])
    w = np.array([0.4, 0.25, 0.35])
    return np.sum([w[i] * norm.pdf(x, mu[i], sig[i]) for i in range(3)], axis=0)
lintsampler can efficiently draw samples from it on some defined interval (here a 100-point grid between -7 and 7):
from lintsampler import LintSampler

grid = np.linspace(-7,7,100)
samples = LintSampler(grid,pdf=gmm_pdf).sample(N=10000)
Making a histogram of the resulting samples and comparing to the input density function shows good agreement – and we can do even better by increasing the resolution of the grid or the number of samples.